Loading...
Large posterior circulation infarct, obstructive hydrocephalus (EDNeurorad Case V9, part 3)
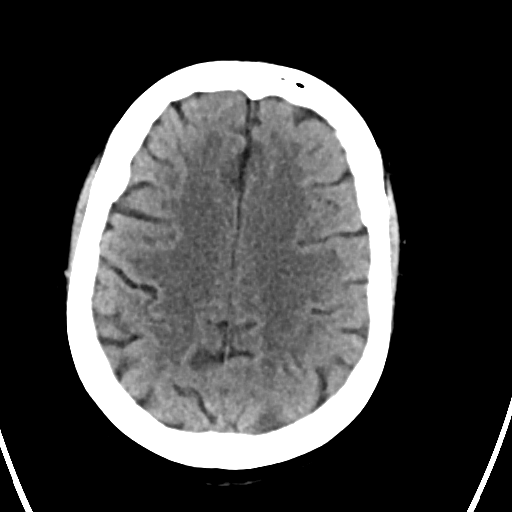
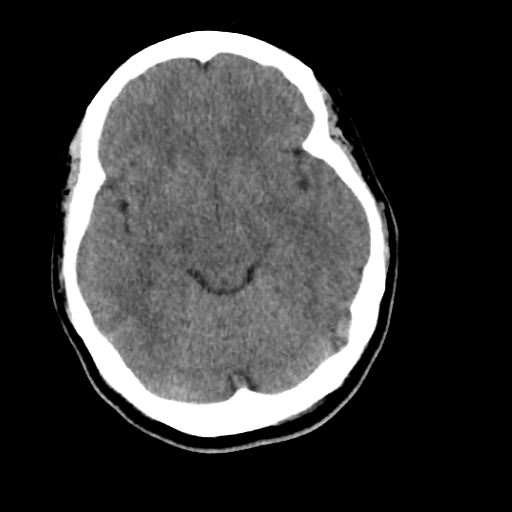
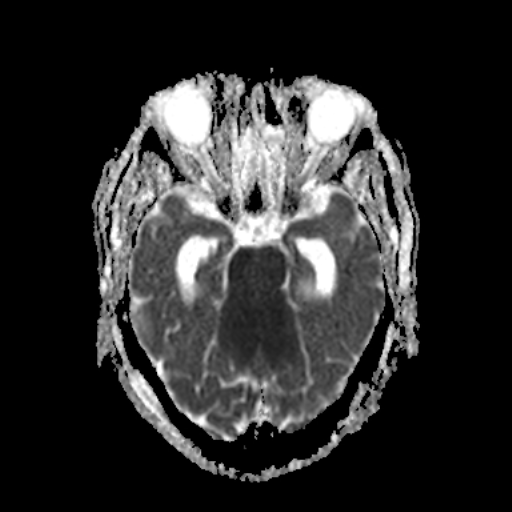
50 views8 months agoDiffusion images show a large infarct core involving majority of brainstem, bilateral cerebella, and bilateral thalami (@Key Finding 1) as well as additional smaller likely microembolic infarcts throughout (both anterior and posterior circulation). FLAIR images show occlusion of the cerebral aqueduct (@Key Finding 2) due to the mass effect with resulting obstructive hydrocephalus and transependymal interstitial edema (@Key Finding 3).
BrainMRI
Basilar occlusion with large matched infarct (EDNeurorad Case V9, part 2)
61 views8 months agoLarge matched perfusion defect in the brainstem and bilateral cerebella (red arrows @Key Finding 1 and @Key Finding 2). Additional perfusion defects in the bilateral thalami and occipital lobes, more apparent on TMAX than CBF likely to have some penumbra (@Key Finding 3).Only minimal patchy opacification of the basilar artery and bilateral PCAs as shown on @Key Finding 4. Note that there is a lot of venous contamination in both PCA regions. There is also little to no opacification of both distal vertebral arteries (@Key Finding 5 and @Key Finding 6).
Head and neckCTA, CTP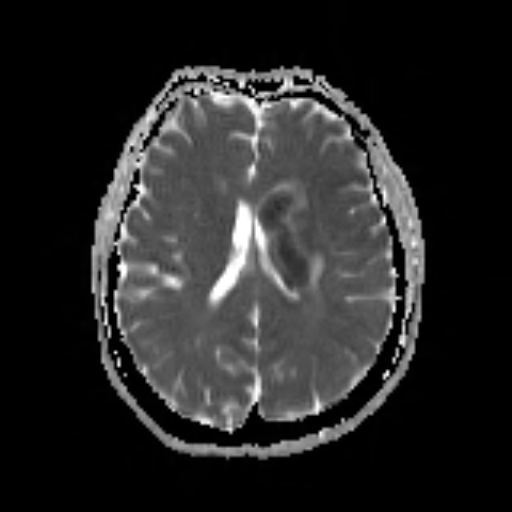
Multifocal infarct, partial hemorrhagic conversion (EDNeurorad Case V7, part 3)
53 views8 months agoDWI images show an infarct core in the left basal ganglia (@Key Finding 1). Interestingly, there is also an area of core infarctions in the left occipital lobe in the PCA territory (@Key Finding 2). Why this PCA infarct occurred is not entirely clear. MRA images show nice revascularization.There are small regions of hemorrhage as seen by T2 dark areas (@Key Finding 3) with associated susceptibility artifact (@Key Finding 4)
BrainMRI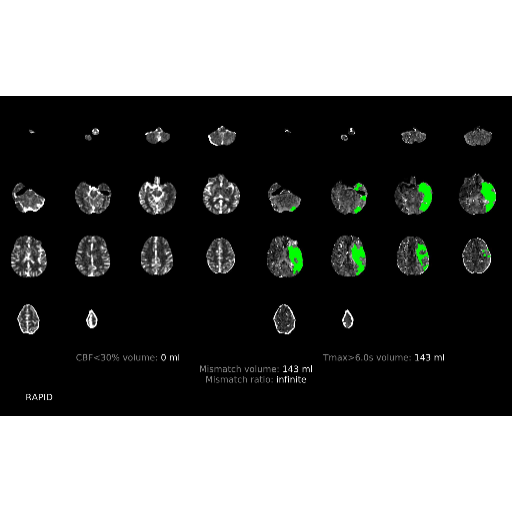
ICA terminus thrombus + mismatched infarct (EDNeurorad Case V7, part 2)
45 views8 months agoCTA is again a bit tricky to interpret. There is thrombus in the left ICA terminus given the abrupt cutoff of the left A1 segment (@Key Finding 1). There is lack of opacification in the left cervical ICA as well forming a layering contrast level (red arrow @Key Finding 2) which as it turns out, is entirely flow related and due to the upstream occlusion. It somewhat mimics a dissection but the layering contrast is a bit too perfect (perfectly horizontal lines are typically the effect of gravity in radiology).Perfusion images show a mismatched infarct with no core and large penumbra (@Key Finding 3).
Head and neckCTA, CTP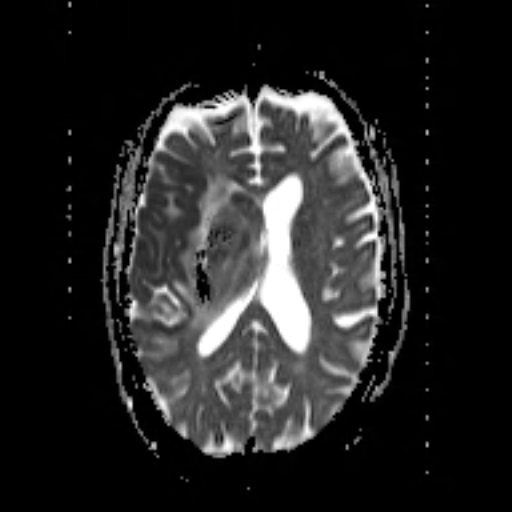
Infarct core with hemorrhagic conversion (EDNeurorad Case V6, part 3)
51 views8 months agoDWI images show a large infarct core predominantly in the right MCA territory (@Key Finding 1 red arrow) but with small areas of infarction also in the right ACA territory (blue arrow). There has been hemorrhagic conversion as seen on the T2 image for instance (@Key Finding 2) with mass effect, mild midline shift, and effacement of the right lateral ventricle. The MRA shows revascularization.
BrainMRI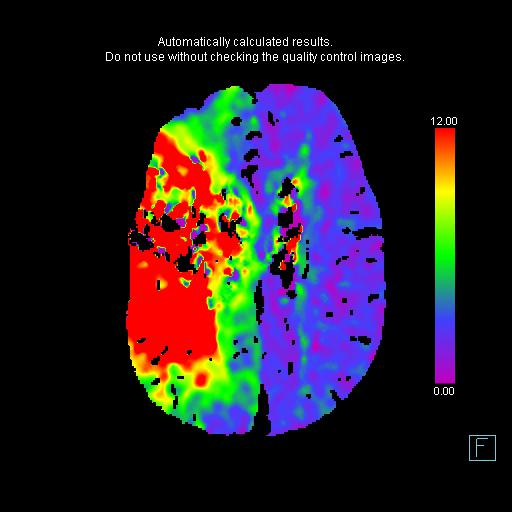
Right carotid terminus occlusion, matched infarct (EDNeurorad Case V6, part 2)
41 views8 months agoAll interventional trials have used CBF to define the ischemic core and TMAX to define the ischemic at risk parenchyma. Using that convention, this is a matched defect without penumbra @Key Finding 1 and @Key Finding 2. This case was before the era of RAPID and if you use the older convention of CBV for ischemic core (@Key Finding 3) and CBF for at risk parenchyma, the core is smaller than the at risk parenchyma and the patient would be considered for intervention.Interpreting the CTA is tricky. There is for sure a right carotid terminus occlusion as you can see the abrupt cut off of both right PCoM (@Key Finding 4) and right A1 (@Key Finding 5), in addition to seeing the strong evidence for clot on non-con CT. While there is lack of opacification of the right cervical ICA shortly after the bifurcation (@Key Finding 6), this can be entirely flow related due to the upstream occlusion and resultant extremely slow flow.Bonus: There is also PE (@Key Finding 7).
Head and neckCTA, CTP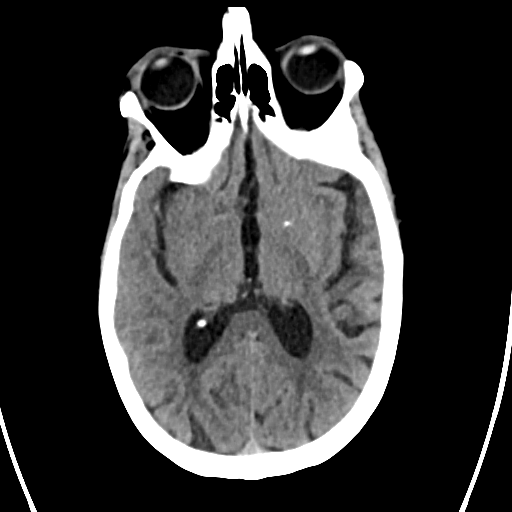
Hyperdense ICA terminus + MCA sign (EDNeurorad Case V6)
51 views8 months agoThere is likely beginning loss of grey-white differentiation in the right insula (@Key Finding 1). Importantly, there is hyperdense vessel sign of the right ICA terminus and right M1 segment consistent with clot going from the carotid terminus to the M1 segment (@Key Finding 2). You can see it on regular thick section images but the MIPs from thin sections really brings it out.
HeadCT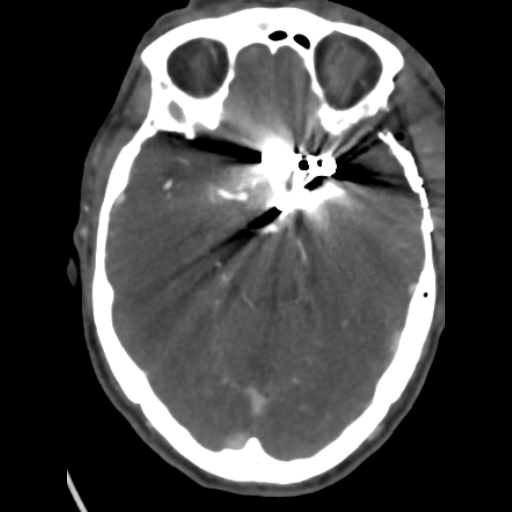
Intracranial vasospasm (EDNeurorad Case V5, part 3)
65 views8 months agoCTA images done post op following clipping of both aneurysms show multifocal vasospasm. This is particularly true of the ACAs as best demonstrated on sagittal MIPs (@Key Finding 1) as well as the bilateral, right left, PCAs (@Key Finding 2).
HeadCTA